Many factors need to be considered to evaluate the health of a building or a bridge. Temperature, strain, tilt, vibration and even wind speed should be included in the inspection. Only checking the value stored in the server is far from a convenient or efficient way for monitoring the structural health. A good sensor network should have good
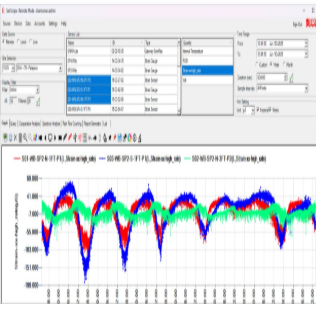
software to visualize and help analyze the collected data. Therefore, team developed multi- functional and easy-to use software to achieve this goal: SenScope.
SenScope is a software package designed for SenSpot and SeniMax system, conducting both real-time monitoring and long- term structural health diagnosis. SenScope is capable of converting large volumes of data into specific structural diagnostics information. The information generated by SenScope facilitates decision- making and accelerates the course of action for maintenance/repair.